-
20th July 2017, 04:36 PM
#1
Statistical Analysis
Thought this was pretty cool.
I've been messin' around with the eDart and Minitab software to understand statistical analysis a little more.
The goal would be to translate the analysis into a sentence.
For example, "I'm 99.XXX% confident the cushion value will land within the reference control limits 99.XXX% of the time."
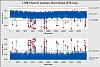
Based on the graphs below, I have two givens:
1) The UCL and LCL were established at 6 standard deviations from the historic mean.
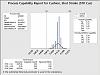
2) Overall process capability for cushion is 1.51 Ppk / 1.50 Cpk
What conclusion can I draw from this?
Thoughts!?
-Chris
-
20th July 2017, 07:09 PM
#2
Re: Statistical Analysis
What I notice is the difference between actual and expected performance:

In terms of statistics, my guess is that means your data are not normal, so the analysis is not statistically valid. If the data fit a different distribution, you can analyze capability accordingly in Minitab.
In the real world, I would suspect that your instances of low cushion are due to special-cause (non-random) variation. For instance, if you were running semi-auto, the operator might be wandering off to talk to his buddy periodically, so you get a longer residence time and a hot shot.
-
21st July 2017, 03:23 PM
#3
Re: Statistical Analysis
Yes, pretty cool but as JayDub says there are some outliers and so it is not a normal distribution. However, it seems tight. What is the resolution (least count) of the measurement? That could also mislead us.
Suhas
-
31st July 2017, 06:16 PM
#4
Re: Statistical Analysis
JayDub - These spikes certainly aren't from any normal distribution. Went back and viewed the graphs for these spikes - there was an up-and-down "blip" in the injection pressure curve. My theory was an injection valve was sticking every now and then.. (20+ year old hydraulic machine).
Suhas brings up a really good point about resolution. Originally thought the resolution was to the 0.000000" position because that's how the edart displayed the values.
Went back to look at the data at found this:
There's certainly no way anyone would get 6 exact same values (of 17 values) if the resolution truly was to 0.000000" ..
I'm guessing we're only limited to the resolution of the encoder on the liner stroke, not the data itself.
-
31st July 2017, 06:22 PM
#5
Re: Statistical Analysis
After reviewing the raw data - found the encoder only displays resolution to around 0.0025" of liner stroke.
This may not even be sufficient in detecting shorts for pipette tips w/ 0.018" tip ID..
-
2nd August 2017, 03:32 PM
#6
Re: Statistical Analysis
Chris –
You are discovering the real strength of statistical analysis. A lot of people would have looked at the Cpk of 1.51, declared victory and moved along. But by looking into the outliers and oddities, you have gained a lot more insight into the process.
 Posting Permissions
- You may not post new threads
- You may not post replies
- You may not post attachments
- You may not edit your posts
-
Forum Rules


 Reply With Quote