-
20th July 2017, 04:36 PM
#1
Statistical Analysis
Thought this was pretty cool.
I've been messin' around with the eDart and Minitab software to understand statistical analysis a little more.
The goal would be to translate the analysis into a sentence.
For example, "I'm 99.XXX% confident the cushion value will land within the reference control limits 99.XXX% of the time."
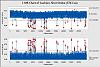
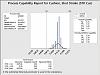
Based on the graphs below, I have two givens:
1) The UCL and LCL were established at 6 standard deviations from the historic mean.
2) Overall process capability for cushion is 1.51 Ppk / 1.50 Cpk
What conclusion can I draw from this?
Thoughts!?
-Chris
 Posting Permissions
- You may not post new threads
- You may not post replies
- You may not post attachments
- You may not edit your posts
-
Forum Rules


 Reply With Quote