-
24th April 2017, 08:09 AM
#1
 PVT (Pressure-Volume-Temperature) Diagram.
Hi Everyone,
Can someone explain PvT diagram in detail. I only know one thing about PvT is, we can identify Crystalline or Amorphous material. Apart from that what are the other things we can identify related to plastic injection molding processing . Please share views .
Thanks
Mandar .
-
24th April 2017, 03:02 PM
#2
Re: PVT (Pressure Volume temperature) Diagram.
Search the website that sponsors this forum, better yet buy Suhas' book on Scientific Molding, and attend one of his seminars if possible!
KOM
brent
-
27th April 2017, 08:07 PM
#3
Re: PVT (Pressure Volume temperature) Diagram.
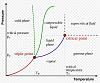
Not sure I'm best suited to answer this question but as I understood it, it allows the researcher to identify relationships between Pressure, Volume, and Temperature of a specific material. In return allowing us to identify critical points or "phases" of that material. Sometimes known as phase diagrams.
For example: if you increase temperature by 'X', volume will increase by 'Y', and Pressure remains unchanged.
Or if you reduce pressure by 'A,' volume remains unchanged, but temperature reduces by 'B.'
The important part is these relationships are not linear/predictable (like Boyle's Gas Laws) so these PVT graphs help us identify 'phases' or critical points of these relationships.
If someone has a better explanation please share!
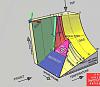
The 2 graphs below are just temperature vs pressure diagrams but imagine a Z axis with increasing pressures and you'll have a 3-dimensional looking 'wavy' diagram.
Not exactly sure how PVT is useful in injection molding because now you've introduced time (or speed/rate) so I'd think a whole new set of variables opens up. And this all changes even more when part and/or tool geometry changes.
For example: a flow-front of a cross-section of say, 0.5 will flow faster than a cross section of 1.5 - even though injection rate on the machine hasn't changed.
The same could be said for pressure: Some areas will inhibit higher pressure than other areas due to speed of injection, temperature, part geometry, and it's relation to the gate.
That being said the PVT graph would theoretically change in each section of the mold and in each section of each dimension.
However I suppose you could maybe use PVT to loosely identify an operating window or 'sweet spot' to maximize crystallization under realistic conditions. Or whatever you're trying to achieve.
I'd be curious to see if others have in fact used PVT for injection molding, and how it helped them
-
19th May 2017, 04:46 PM
#4
Re: PVT (Pressure Volume temperature) Diagram.
Hey Mandar,
The information on these curves are typically used in mold filling simulation and have little practical use on the shop floor. In simulation, PVT information allows the computer to take into account the materials compressibility, which helps the simulation better predict the materials behavior during the packing phase (stage 2). I say it is impractical for a molder on the floor because I can grab information such as how much a semi-crystalline material will shrink in volume from unfolded crystals in the melt to fully crystallized finished parts and that’s about it. You can clearly see the materials glass transition temperature but you should also be able to find this information on a data sheet.
The information is fun but useless unless you’re trying to make sure you have enough shot size to make a full shot plus cushion, which you should be able to find solid density and melt density data on the material data sheet to make that calculation.
I hope this helps!
Tags for this Thread
 Posting Permissions
- You may not post new threads
- You may not post replies
- You may not post attachments
- You may not edit your posts
-
Forum Rules


 Reply With Quote